How to Combine RSI, MACD, and Moving Averages for Smarter Trade Entries
6/29/2025
Introduction
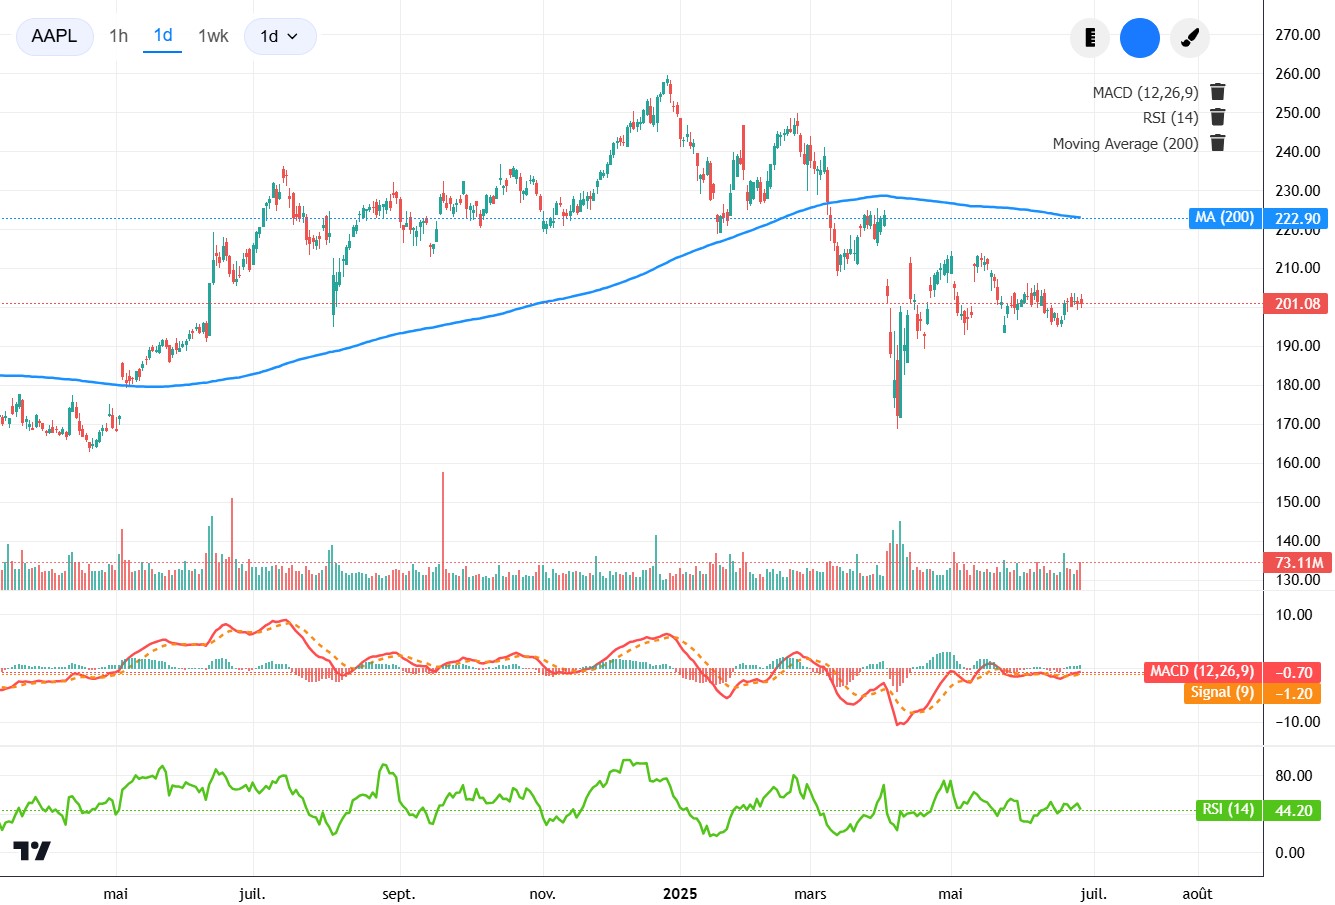
Using only one indicator, such as the Relative Strength Index (RSI), can lead to many wrong signals. You might enter a trade too early and lose money.
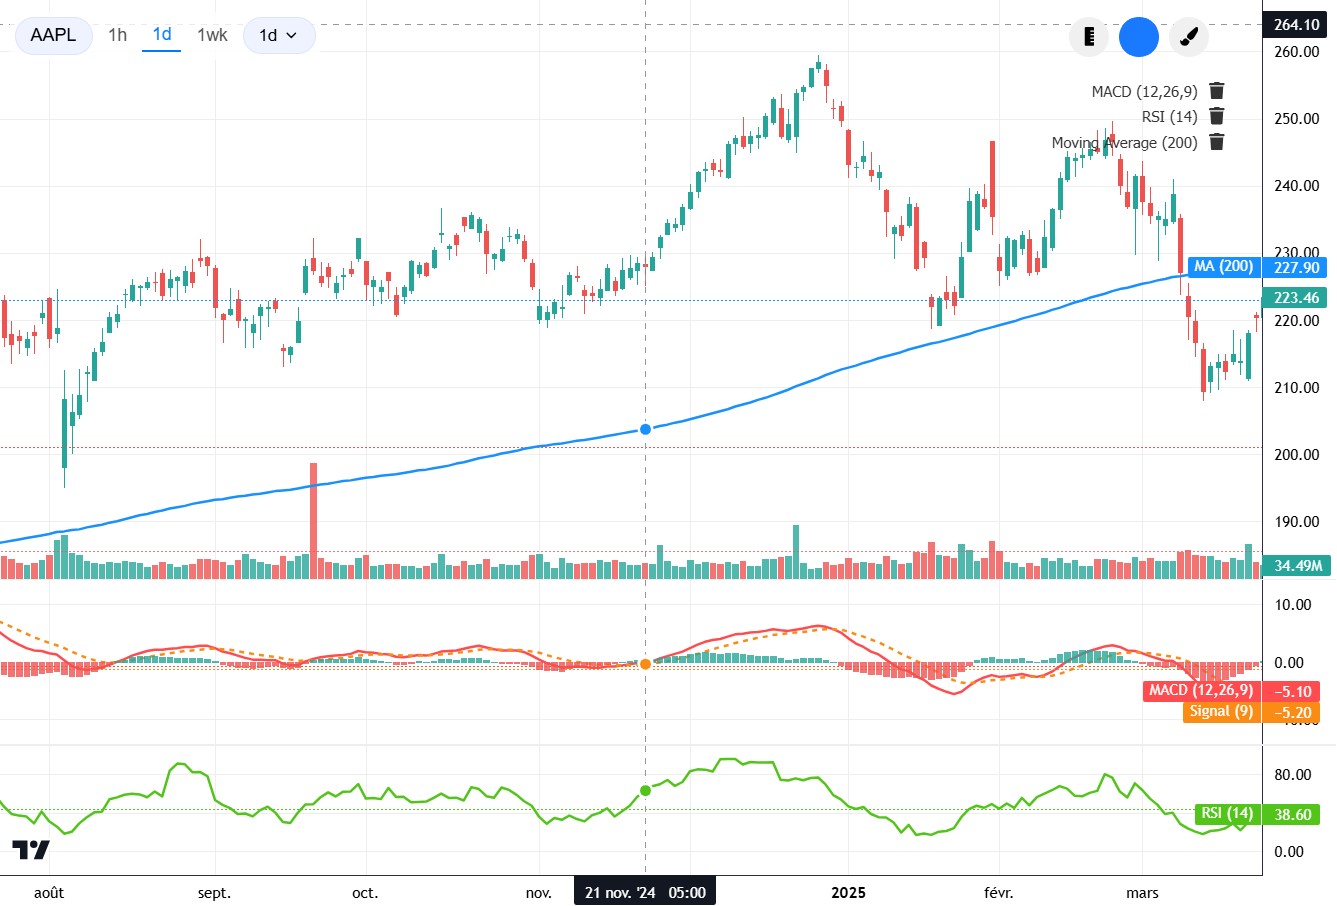
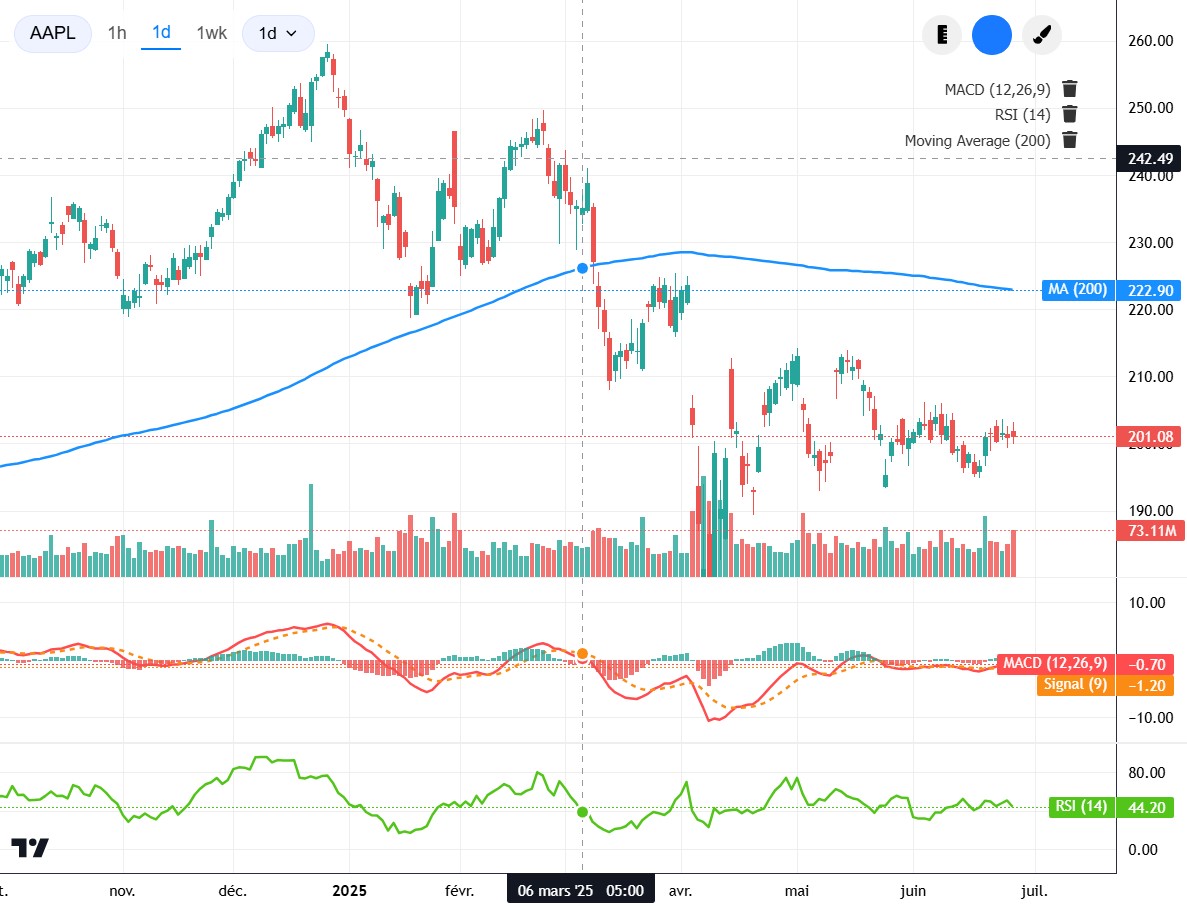
By combining three tools—RSI, Moving Average Convergence Divergence (MACD), and Moving Averages (MA)—you can get clearer signals. These three together help you:
- RSI shows when the market is overbought or oversold.
- MACD confirms if the price trend is changing.
- Moving Averages (SMA/EMA) show the main trend and act as support or resistance.
This article explains each tool, how they work together, a step-by-step strategy, and an example backtest.
1. Indicator Breakdown
1.1 RSI – Relative Strength Index
- What it shows: Strength and speed of price moves on a scale of 0–100.
- Key levels: Above 70 means overbought, below 30 means oversold.
- Good for: Finding early chances to buy or sell.
- Limitations: Can give wrong signals in strong trends.
Example: If RSI falls below 30 and then moves back above, it may be a sign to buy. But in a strong uptrend, RSI can stay above 70 for a long time.
1.2 MACD – Moving Average Convergence Divergence
- What it shows: Difference between two exponential moving averages (EMAs), usually 12 and 26 periods.
- Signal line: A 9-period EMA of the MACD.
- Histogram: Shows how far MACD is from the signal line. Positive means upward momentum, negative means downward.
Example: When the MACD line moves above the signal line, and the histogram turns positive, it can mean a price rise is starting.
1.3 Moving Averages (SMA/EMA)
- What they show: The general price direction by smoothing out price data.
- Common types: 50-day and 200-day moving averages.
- Use as: Trend filter (only trade in the trend direction) and support/resistance levels.
Example: If the price is above the 200-day EMA, the trend is up, so you look for buy signals only.
2. Why Combine These Tools?
- RSI gives an early hint that price may turn.
- MACD checks if that hint is real by confirming the trend change.
- Moving Averages make sure you trade with the main trend, not against it.
Using all three helps you avoid many wrong signals and find better entries.
3. The Strategy
Choose your time frame (daily or 4-hour charts work well). Here is how to enter and exit trades:
3.1 Buy Rules
- Trend Check: Price closes above the 200-day EMA.
- RSI Check: RSI has been between 40 and 60, then moves up.
- MACD Check: MACD line crosses above the signal line, and the histogram is positive.
- Volume Check (optional): Trading volume is above its 20-period average.
Entry: Open a buy order at the next candle open.
Stop-Loss: Place below the recent low or use 1–2% below entry.
Take-Profit: Set at 2 or 3 times the risk, or move your stop below the 50-day EMA as price moves up.
3.2 Sell/Short Rules
- Trend Check: Price closes below the 200-day EMA.
- RSI Check: RSI has been between 40 and 60, then moves down.
- MACD Check: MACD line crosses below the signal line, and the histogram is negative.
Entry: Open a sell order at the next candle open.
Stop-Loss: Place above the recent high or use 1–2% above entry.
Take-Profit: Aim for 2 or 3 times the risk, or move your stop above the 50-day EMA as price falls.
4. Common Mistakes
- Relying on RSI alone: Wait for MACD and trend confirmation.
- Ignoring trend: Do not trade against the 200-day EMA.
- Overtrading small charts: Stick to daily or 4-hour time frames.
- Skipping stop-loss: Always protect your money.
5. Extra Tips
- Check higher time frames: Look at weekly charts to see the main trend.
- Use candlestick patterns: A hammer or bullish engulfing can add confidence.
7. Managing Risk and Emotions
- Position Size: Risk only 1–2% of your account per trade.
- Move stops: After some profit, move your stop to break even.
- Keep a journal: Write down each trade and review what went well or wrong.
8. Conclusion and Next Steps
Combining RSI, MACD, and Moving Averages helps you:
- Spot early signals.
- Confirm true changes in trend.
- Trade with the main market direction.
Ready to learn more?
- Test our AI powered app by clicking on the top page Launch App button.
Good luck, and happy trading!


